

Superatom pioneered Generative UI. We were first to market with the ability to automatically generate interactive UI components from raw data sources.
The Problem
Business users need to see data in visual formats, but:- Building custom dashboards is expensive (10K+ per dashboard)
- Each new question requires development work
- Pre-built dashboards become stale as business needs change
- Users are limited to what’s already been built
How Generative UI Works
Stage 1: Understanding Intent
The AI parses the natural language question to extract:Stage 2: Query Generation
SQL is generated and executed against your semantic model:Stage 3: Data Analysis
Before visualization, we analyze the result set:Stage 4: Component Selection
Based on data characteristics, the optimal visualization is chosen:- Selection Logic
- Component Library
Stage 5: Configuration
Each component is configured with:- Color schemes based on data semantics (red for negative, green for positive)
- Axis labels derived from column names
- Tooltips with relevant details
- Legends for multi-series data
- Interactivity (click, hover, drill-down)
Stage 6: Rendering
The final component is rendered as an interactive React component with:- Real-time responsiveness
- Export capabilities (PNG, CSV)
- Bookmark/save functionality
- Drill-down options
- Follow-up question suggestions
Visual Examples
From Question to Visualization
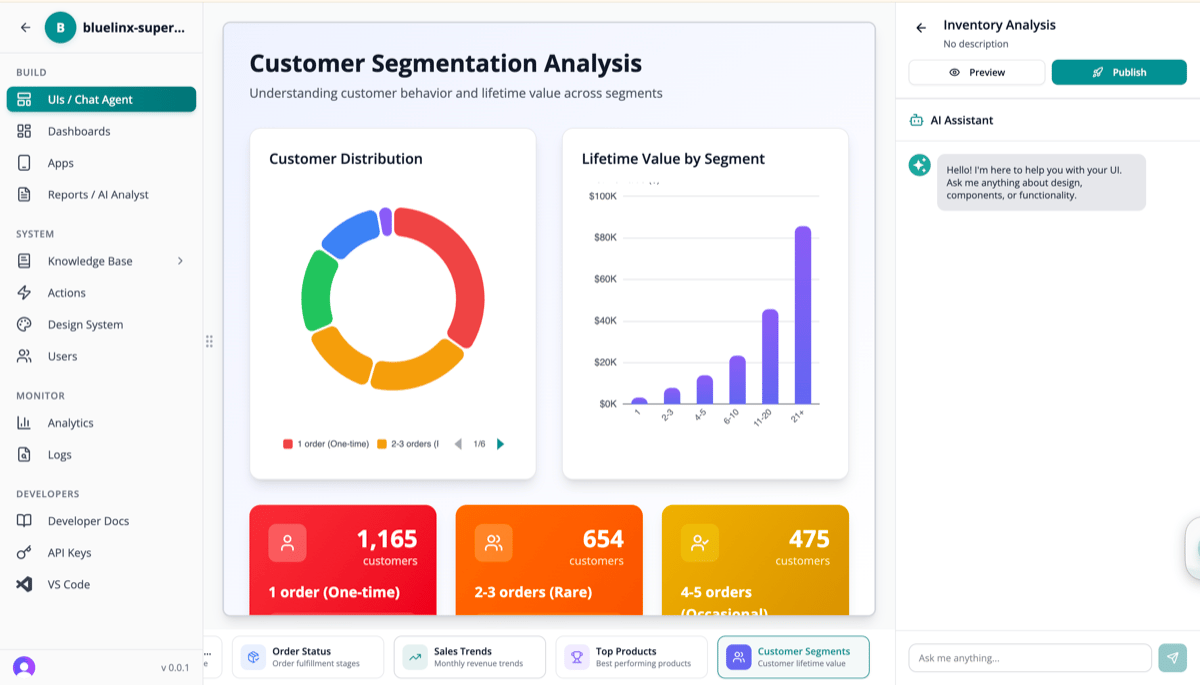
Customer Segmentation Analysis - automatically generated from query
- Selected a donut chart for customer distribution (categorical proportions)
- Selected a bar chart for lifetime value comparison (categorical + values)
- Created KPI cards for key segment metrics (single values)
- Arranged components in a logical layout
The Intelligence Behind Selection
Decision Tree Example
Contextual Adaptation
The same data can be visualized differently based on context:Technical Implementation
Component Architecture
Technology Stack
Why This Matters
Business Impact
Zero Development Cost
No dashboard development needed. Every question gets a custom visualization instantly.
Unlimited Flexibility
Users aren’t limited to pre-built views. Any question, any visualization.
Always Current
No stale dashboards. Every visualization is generated fresh from live data.
Democratized Access
Business users don’t need to know SQL or BI tools. Just ask questions.
Competitive Advantage
Next Steps
Tribal Knowledge
Adding organizational context to visualizations
Platform: Chat Agent
See Generative UI in action