

The Decision Loop
Superatom implements a continuous decision-making loop:Semantic Model
The semantic model is Superatom’s understanding of your data:Schema Understanding
Tables, columns, relationships, data types
Statistical Profile
Distributions, patterns, common values
Domain Context
Industry-specific interpretation
Query Capability
What questions can be asked
Tribal Knowledge
Organization-specific knowledge captured at three levels:Generative UI
Automatic visualization creation:1
User Asks Question
Natural language query submitted
2
Data Retrieved
SQL generated and executed
3
Data Analyzed
Result set profiled for characteristics
4
Component Selected
AI chooses optimal visualization
5
UI Rendered
Interactive component displayed
Knowledge Nodes
Building blocks of organizational knowledge:Knowledge Graph
Visual representation of how concepts connect: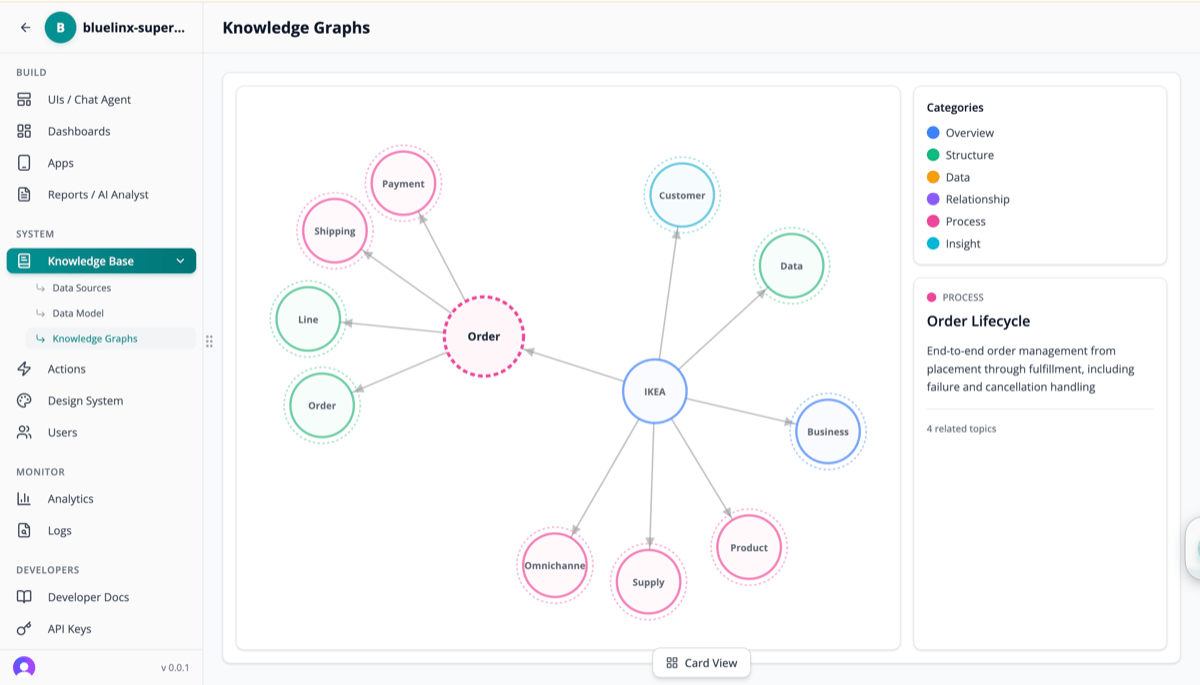
- Entities - Orders, Customers, Products
- Processes - Workflows, lifecycles
- Insights - Derived knowledge, calculations
Coding Agents
AI agents that understand business context: Agents can:- Break complex questions into sub-tasks
- Generate and execute multiple queries
- Iterate until they find the answer
- Explain their reasoning
Dry-Run Execution
Safe action execution with human oversight: Actions are simulated first, showing what WOULD happen before committing.Project Isolation
Each deployment is completely isolated:Separate Infrastructure
Dedicated Durable Objects per project
Data Isolation
No cross-project data access
Independent Scaling
Resources scale per project needs
Security Boundary
Complete security separation
Real-Time Streaming
Responses appear as they’re generated:- Text streams character by character
- Charts build progressively
- Tables populate row by row
- Follow-ups appear after main content
Multi-LLM Support
No single AI vendor dependency:
Switch providers based on task, cost, or preference.
Key Terminology
Next Steps
Quickstart
Get started in 15 minutes
Architecture
Technical deep dive